The page is headed Sessions & tilt. The drawer and the wheel both label it with the single word Sessions, because the wheel draws every label into a fixed segment and the longer name gets cut off there.
Everything here is cut by time. How an evening goes as it gets longer, what a losing run does to the games after it, how the runs of games against one person end, what changing character costs you mid-session. The tilt readings used to sit on the dashboard and the session-length table used to sit on Health; they are all here now, and the dashboard keeps two of the tilt figures as a tile that links back.
What a session is
A session is a run of matches with no long pause inside it. When the gap from one match to the next is strictly longer than your session gap, the next match opens a new session. A gap of exactly the setting stays in the session it is in. The gap starts at 45 minutes and lives in Settings under Analytics, with the other controls that change what the numbers say.
One match with nothing near it is still a session, of one game. A session's length is the time from its first match to its last, plus four minutes for the last match itself, which is why that one-game session runs four minutes and not zero.
Sessions are found one account at a time. If your profile unions two Tekken accounts, their timelines are separated before any of this runs, so an evening on one account can never swallow matches played on the other.
The gap is not a display preference. It decides where one evening becomes two, and most of this page is counted per session, so the numbers move when you move it: the length buckets, playtime per week, best and worst sessions, the session table, the give-back, quit and requeue rows inside Tilt, all of Sets and runbacks, and all of Switching character. Widening it from 45 to 90 minutes merges evenings that had a long dinner in the middle and every one of those figures changes.
Panels that read the order of your results, with no clock in them, hold still: After a streak, Streak distribution, and the rematch and character rows inside Tilt.
When a number refuses to appear
Several readings print not enough data yet (n=4 of 10) where a percentage
would go. That is the design working.
A rate over a thin sample reads as a finding no matter what is printed beside it. These readings used to carry a "low sample" badge next to a live percentage, and the badge is the part that gets skimmed; 83% is the part that gets remembered and repeated. So the estimate is withheld outright and the sample is left on screen, which lets you watch it fill and tells you how far off it is.
The floors are not one number:
- Minimum sample size (Settings → Analytics, starts at 10 decided games) gates the four cohort rows on After a streak, all five rates on Sets and runbacks, all three on Switching character, the occurrence floor under which character tilts you, and the matchups named by Where tilt shows up in your data.
- The six readings inside Tilt use a fixed floor of 20 that no setting moves, each against its own cohort. Rating given back is the exception at ten sessions.
- The sweet-spot sentence under Session length vs win rate wants double the sample setting in a single bucket, and a bucket needs three sessions before it gets an interval at all.
Session length vs win rate
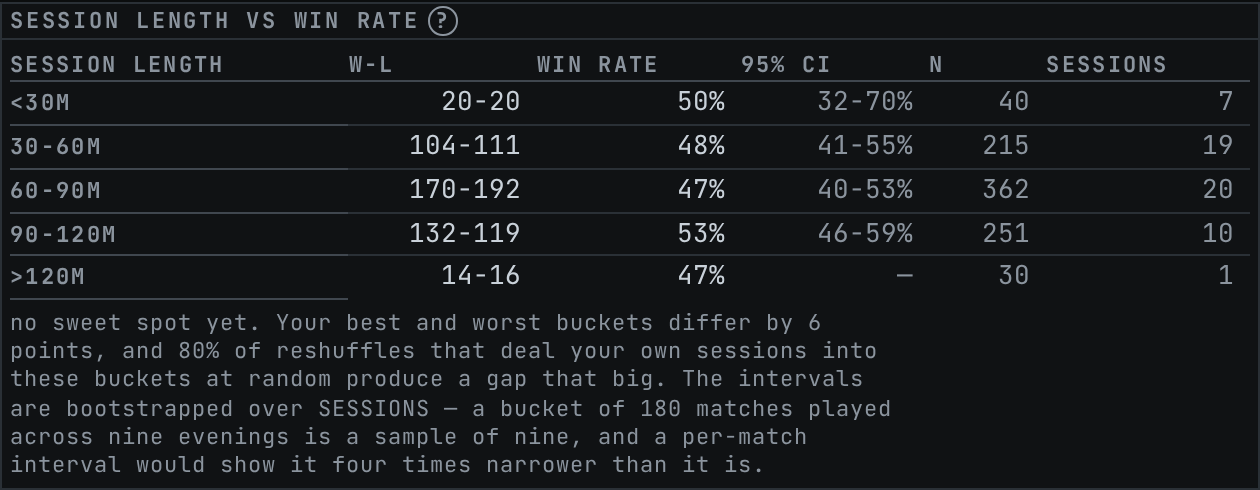
Every session lands in a bucket by its length: under 30 minutes, 30-60, 60-90, 90-120, over 120. The row pools all the matches of every session in that bucket and reports W-L, win rate, a 95% interval, the decided-match count, and the number of sessions.
Read the Sessions column first. It is the real sample size and the reason the interval is as wide as it is. The interval is a cluster bootstrap that resamples whole sessions, so an evening you went 0-12 leaves or re-enters the sample as one object, which is how it arrived. Treating those twelve losses as twelve independent draws is what a Wilson interval would do, and on a real history that makes the widest bucket look about four times more precise than it is.
A bucket holding one session shows no interval. Two sessions show 0-100%,
which is not a bug: resampling two things gives you three possible draws and the
percentiles land on the two rates you already had, so the honest interval is the
whole range.
Under the table sits one sentence with three possible shapes.
- A sweet spot is named only when some bucket clears double the sample floor and the spread across buckets survives a permutation test. The test reshuffles whole sessions between buckets, keeping the number of sessions in each, and asks how often chance alone produces a gap that big.
- When there is a best bucket but the spread does not survive, the sentence says so and gives you the spread in points and the share of reshuffles that beat it. A high number there means the gap between your best and worst bucket is the kind chance produces routinely.
- Otherwise it says no bucket has enough behind it yet.
Taking the highest of five buckets and calling it a sweet spot is the same mistake as naming a best hour off the heatmap, and it is gated the same way. See the dashboard guide for the other end of that argument.
After a streak
Five rows and a verdict, all keyed to your tilt streak length setting, which starts at 3.
The first two rows count what happened in the next five decided matches after a run of that many losses, and after a run of that many wins. A run counts once, at the moment it reaches the length: a five-loss run is one occurrence for a setting of 3, recorded at its third loss.
The comparison beside each rate is against your own results in a random order, not against your overall win rate. Conditioning on "the last three were losses" and averaging what came next is biased downward even for a coin, by around eight points in short sequences, so a comparison against your lifetime rate would report tilt in a record that has none in it. The shuffle carries the identical bias, so what survives the subtraction is real. The reshuffling stays inside stretches of about 200 games, which keeps a player who improved over years from having that improvement counted as tilt.
The next two rows split the single match after a losing run by how long you waited:
- kept playing — the next match started within your kept-playing window, which starts at 10 minutes.
- took a break — it started at or after your took-a-break window, which starts at 45 minutes.
A gap between the two windows counts for neither, since it is too long to be queueing straight back in and too short to be a break. A drawn next match is dropped.
Longest streaks shows the longest win and loss run on record, per account, with draws breaking a run instead of extending or being skipped. Your current streak is not on this page. It is a tile on the dashboard, where it belongs to the "how am I doing right now" reading.
The verdict line
The line under those rows takes a side only when both cohorts clear the sample floor and their 95% intervals stop overlapping. Five outcomes:
| What it says | What produced it |
|---|---|
| no N-loss streaks recorded yet | neither cohort has anything in it |
| not enough … yet to compare | one or both cohorts under the floor, named by which |
| STEP AWAY: breaks measurably help you | the break interval sits entirely above the keep-playing one |
| KEEP PLAYING: you recover fine without breaks | the reverse |
| … is N points ahead, but the ranges still overlap, so no verdict yet | both cleared the floor, the intervals still touch |
That last one is the branch a real history usually lands on, and it used to read "no measurable difference". Picture 45% across several hundred games against 70% across twenty. The gap is 25 points and the ranges still touch, because twenty games is a range some 37 points wide. Telling you there is no difference there invites the conclusion that breaks do not help, which is a claim nothing in that comparison can support.
Tilt
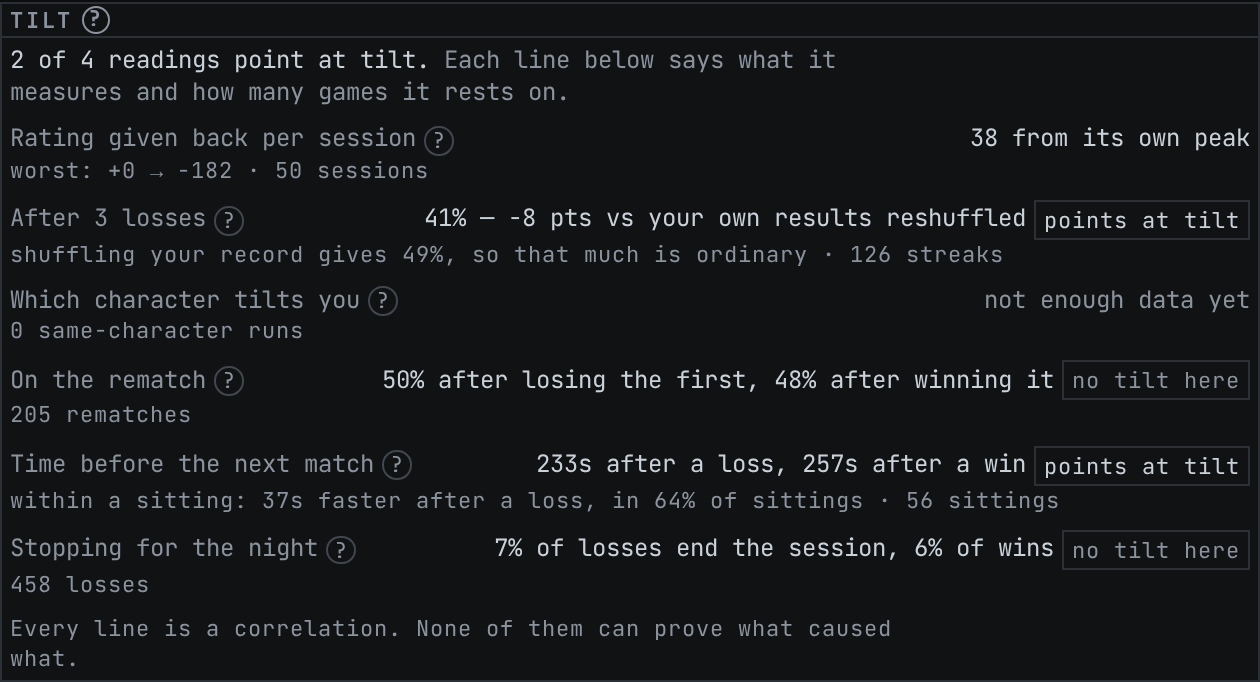
Six readings, each spending the same history a different way. The opening sentence counts how many of them currently have both a direction and the games to back it, and how many of those point at tilt. If you read one thing on this panel, read that sentence.
Each row carries a ? with its own method note, its sample size and unit, and a
chip saying points at tilt or no tilt here. Three of those chips want a
gap of at least five percentage points before they will call anything; the
requeue line wants ten seconds and a direction that holds up across sittings,
and the character line uses its permutation test as its size test. The readings
do not share a direction either: requeueing faster after a loss is the marker,
while a higher win rate never is.
Rating given back per session. Inside one session, how far your rating fell from the highest point it reached during that session. This is not your net result for the evening. A session that finished up can still have handed back forty points from its peak, and that give-back is what people mean by "I should have stopped". Averaged over your last 50 sessions of four or more matches, because the ladder pays roughly five times as much per game during placement as it does once you are settled, and a lifetime average would mostly describe whichever year paid the most. It carries no chip and stays out of the count in the opening sentence, since there is no baseline for a give-back to be worse than.
After N losses, labelled with your streak setting. Your win rate on the single match after a losing run, with the shuffled comparison beside it. Same correction as the rows above, one match wide instead of five.
Which character tilts you. The conditioning run here is two losses in a row to the same opponent character. That number is fixed, and it is deliberately decoupled from your streak setting. Three consecutive losses to one character is a condition real histories almost never produce: it takes an 0-3 set, or three players of the same character back to back. At three the reading says "not enough data" everywhere forever, which is a dead panel. Two is the run people actually experience, a lost set.
The outcome is your win rate over the next five decided matches against anyone. The bar it is held against is your rate after any two-loss run, not your overall rate, since after any losing run the next stretch is already weaker and every hard matchup would otherwise read as tilting.
A character is named only when its deficit survives a permutation test run on the worst deficit across every character that clears the occurrence floor. That is the same guard the best-hour headline needs, and for the same reason: scanning the whole roster for a worst one will always find a worst one. Labels are shuffled within blocks of consecutive occurrences, so a character you only met during your weakest season cannot borrow that season's losses as evidence. "No character stands out" is the expected answer on most histories, and the panel prints the worst one anyway, marked as inside what reshuffling produces.
On the rematch. Your win rate in games 2+ of a set, split by whether you won or lost game 1. The clearest line here, because the opponent is held fixed between the two games. Losing the first game is also evidence they are simply better, and nothing separates that from tilt.
Time before the next match. Median seconds from one match ending to the next starting, after a loss against after a win, with each sitting compared against itself. Pooling every gap across a whole history reads a slow era as a mood: on a multi-year record whose queue times shortened while the win rate rose, the pooled version invented a 20-second tilt gap out of data with none. One evening has one queue and one mood. The verdict needs the paired median to reach ten seconds and the share of sittings running that way to hold up under a 95% interval, since a handful of lopsided evenings is not a habit.
Stopping for the night. How often a session ends on a loss against how often it ends on a win. Ending on a win is ordinary, people stop while they are ahead; the size of the gap is the thing to look at. Every session ends on exactly one match, so these rates describe how your evenings finish whatever your overall loss rate is.
Every line here is a correlation. A break is chosen and never assigned, so someone who stops when they feel bad produces the same numbers as someone whose break helped.
Sets and runbacks
A set is the run of consecutive games against one person inside one sitting, on one of your accounts. The opponent is identified by account: a player switching character mid-set is the same person, and a different player on the same character is not a rematch at all. Meeting somebody again next week starts a new set, because the sitting bound is what makes the no-rematch counts mean anything.
Sets against games puts your set win rate above your game win rate over the same pool of games. Sets that ended level are counted and then excluded from the set rate, since they belong in neither column. The sentence underneath states the gap between the two rates in points, taken between the rounded percentages on screen, since those are what you can check it against. A game rate well above the set rate is the shape of winning games and losing sets.
First to two counts the sets that reached one game each, how many of those played a third game, and your record in those deciders.
No rematch gives the share of your losses after which no next game against that player happened, then the same after your wins. Your own side goes first deliberately.
These two rates say that no next game happened, and nothing beyond that. The export is a list of finished matches with no lobby events in it. You moved on, they moved on, the matchmaker sent you elsewhere, somebody's connection dropped: all four leave the identical record. Nobody can tell from this data who stopped, so the labels name what happened and leave the actor out of it. "My opponents quit on me 40% of the time" is not a claim this can carry, and if you happen to know you were the one who left, a panel telling you otherwise would be a good reason to distrust every other number on the site.
The last game of a sitting is left out of both counts. There was no next game against anyone, so whether the set would have continued is not observable. Sessions ending on a loss are already their own reading, up in Tilt under Stopping for the night.
Each of the five rates has its own sample and its own floor. The per-game runback counts use nearly every match you have played, while the deciders need a set to reach one game each and then keep going, so they fill at very different speeds and one shared floor would hide the cheap ones for years.
Switching character
A switch is a game on a different character from the game before it, inside the same sitting, on the same account. The comparison cohort is every other game that had a game before it in that sitting.
The first game of every sitting is in neither cohort, and that exclusion is the whole design. An opening game already belongs to the dashboard's warm-up reading. If it counted as a switch whenever last night finished on a different character, it would be published twice and would be wrong both times, since nothing separates cold hands from a new character inside a single game. A player who mains one character on weeknights and another at the weekend would read a large, confident switch penalty that is really Monday morning. How often your character changed between sittings is printed underneath as a plain count, with no rate attached to it.
Three lines:
- First game after a switch — the switch cohort's win rate.
- Playing on with the same one — the continuation cohort's.
- Same characters, no switch — the line to compare against.
The third one exists because the switch cohort is not a random sample of your games. It is stuffed with your secondary characters, since those are what people switch to, so holding it against your flat same-character rate compares two things at once and reports your dabbling as a cost of switching. That line re-weights your same-character win rates onto the character mix of your switch games: for each character you both switched to and played on with, take your same-character rate on it, weighted by that character's share of your switch games. With the mix equal on both sides, what is left is the switch.
A character you have switched to but never continued on has no same-character rate to contribute. Its games sit outside the weighting and get counted separately, and the panel says how many there are.
No rating figures appear anywhere in this panel. A switch crosses ladders by definition, since the new character has its own rating and its own opponents, so adding movement from either side of one describes nobody. There is no verdict either. On most histories the honest answer is that you do not really switch mid-session, and that is a count, not a judgement.
Where tilt shows up in your data
Your three lowest-win-rate opponent characters that clear the sample floor, each linking through to Matchups, which has its own guide. When no matchup qualifies the panel does not render at all, so its absence means nobody cleared the floor.
Losing runs cluster in these, which is where the readings above are drawing from. A hard matchup and a tilting player produce the same rows and this cannot tell them apart.
Best & worst sessions
The best and worst sitting by net rating among sessions of three or more matches, stacked as two rows with the qualifying count underneath. The worst row appears once two sessions qualify; with one, there is only a best. When nothing qualifies the panel says what it is waiting for.
Net rating here sums the corrected per-match movement, which is not the change wavu displays for each match. The dashboard guide explains why the two differ and why summing the displayed one loses points.
An evening you spent switching character has no net rating, and both rows print a dash for it instead of a number. A rating belongs to one character on one account, so adding up a sitting that touched two of them produces a total neither of those ratings ever moved by. The same dash appears in the table below for the same reason.
With hundreds of sessions behind it, some will be extreme by chance alone, so a session at either end proves nothing on its own. Use it as a way to find a particular evening and open it in the table below.
Playtime / week
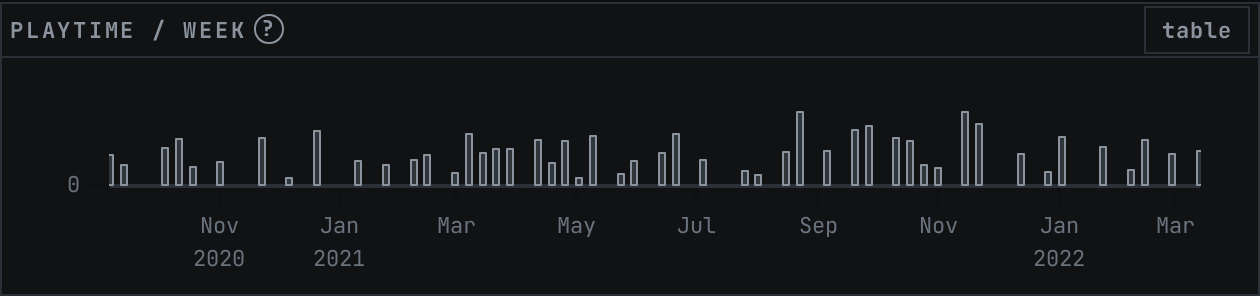
Session minutes summed into fixed seven-day bins. These are 604,800-second windows counted from a fixed anchor and are not calendar weeks, so their edges ignore time zones and daylight saving, and your Week starts on setting shifts every boundary by a day. A session belongs to the bin it started in, even when it finished in the next one.
The header carries a chart/table toggle, and the table has the exact minutes.
Streak distribution
How often runs of each exact length happened, wins and losses in separate columns. A run completes when it is broken by the opposite result, by a draw, or by the end of your history, so the run you are currently on is in here too. Streaks are counted per account.
Long runs in both directions are ordinary. A coin flipped seven thousand times produces runs of ten, so the shape of the whole distribution tells you more than the longest bar in it.
All sessions (gap 45m)
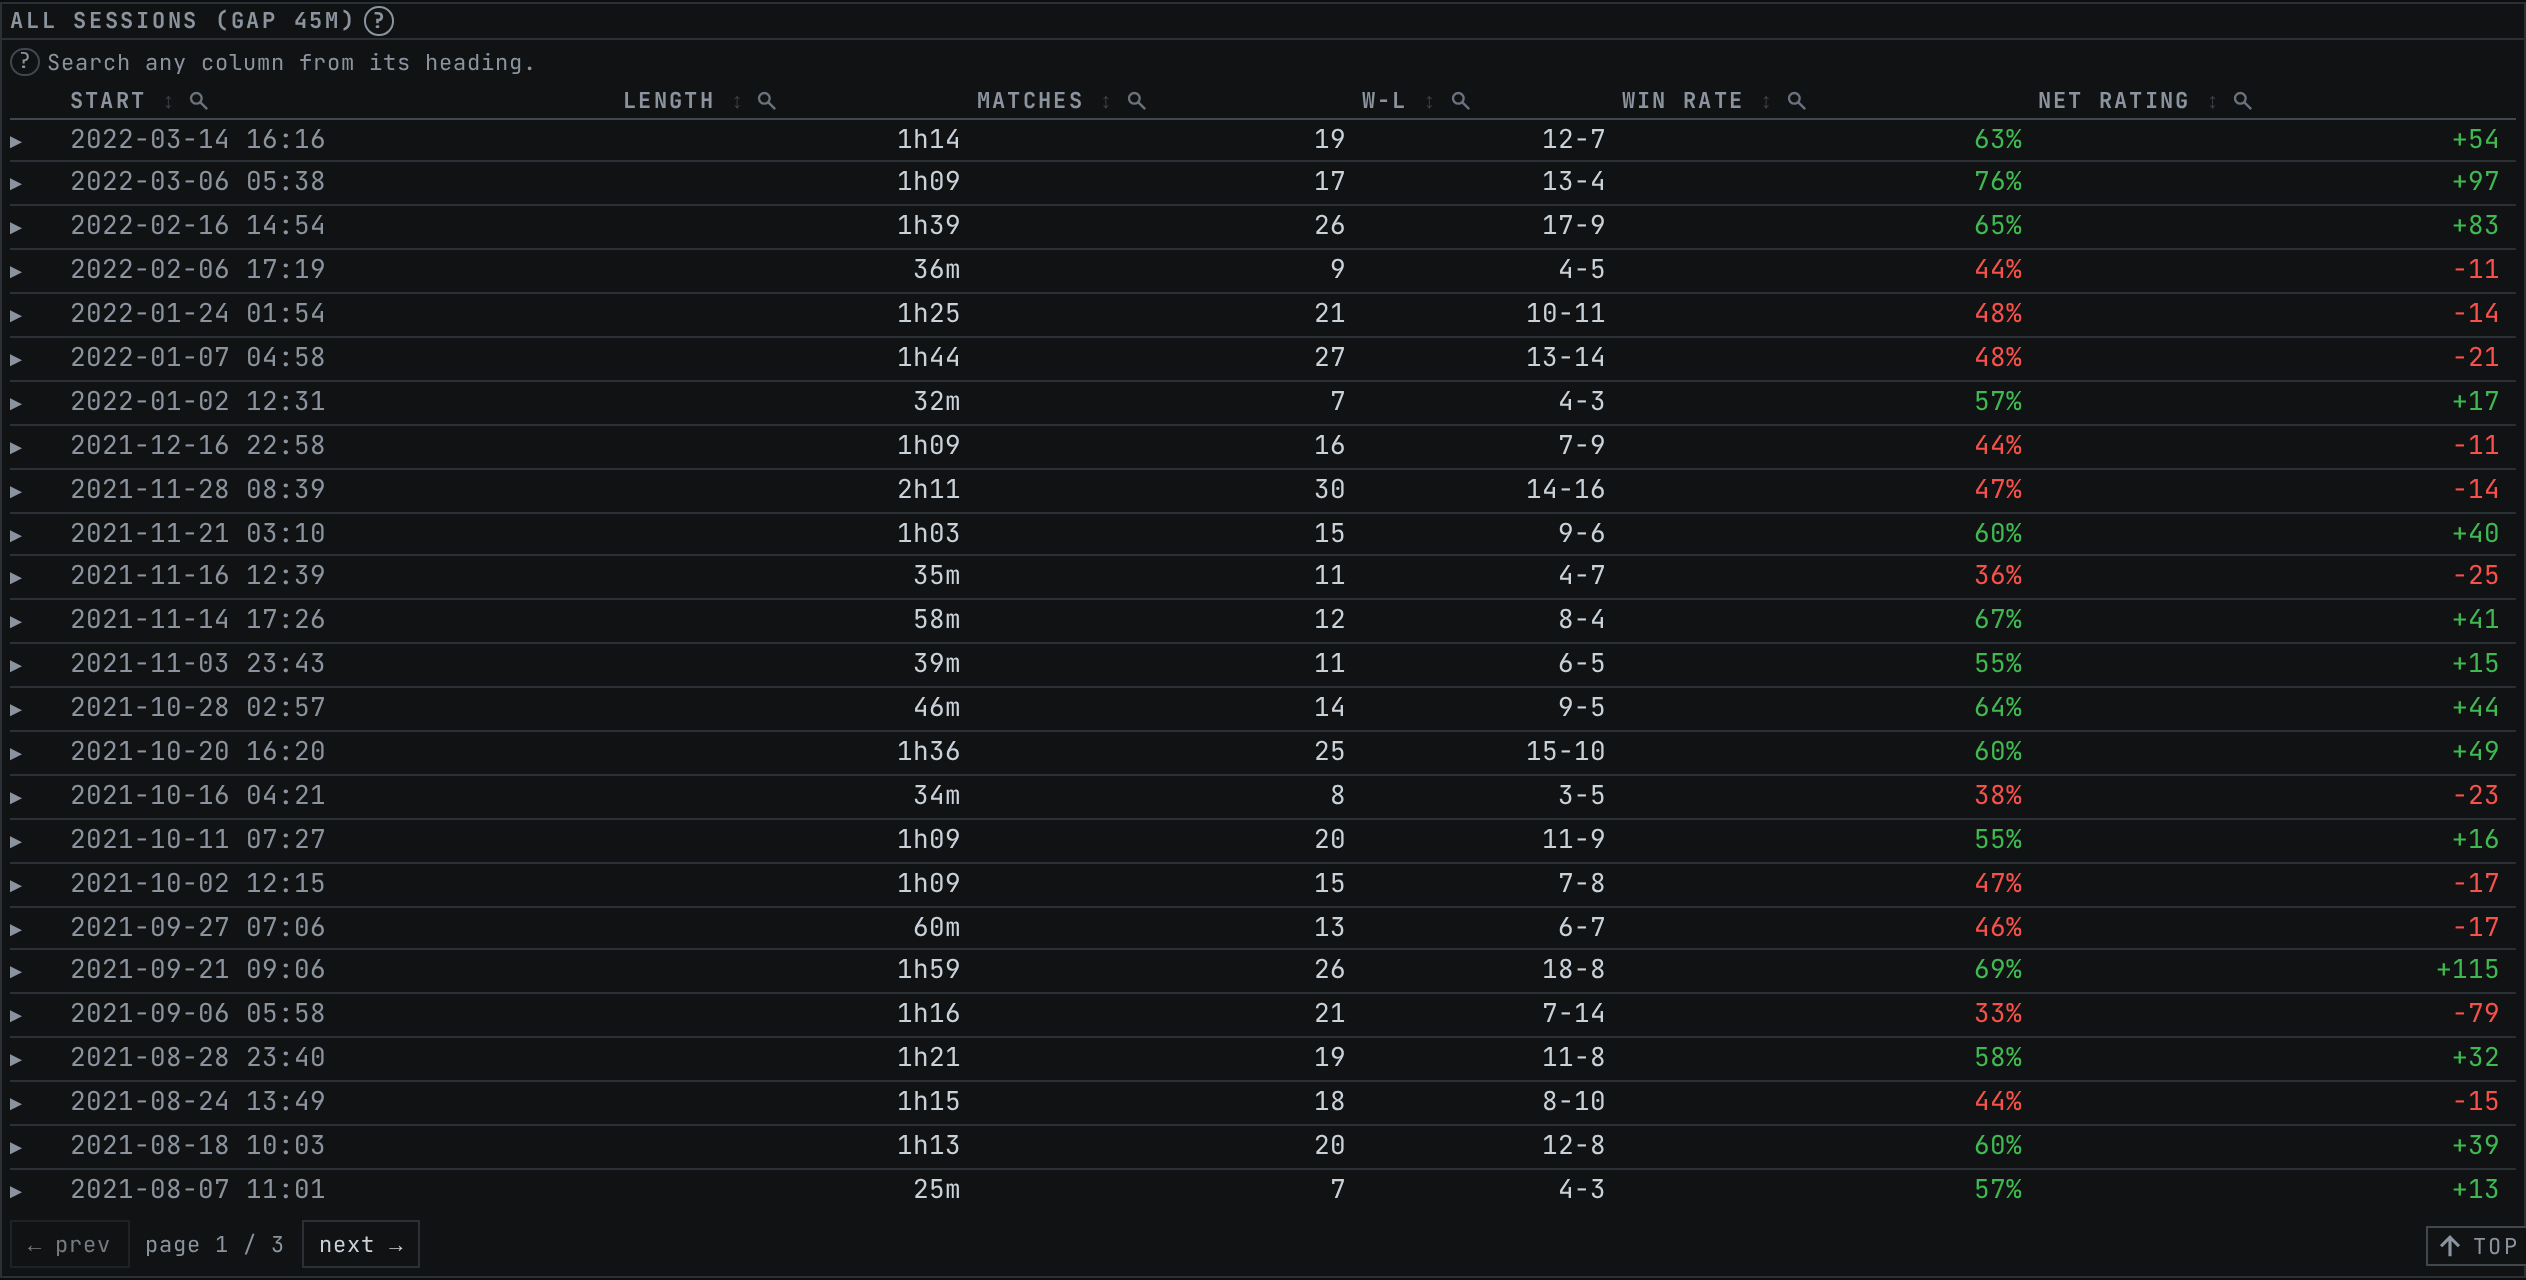
Every detected session, newest first, 25 to a page. The number in the heading is your own gap setting, which is a useful reminder while you are sorting: the rows in this table are a function of that number.
Columns are Start, Length, Matches, W-L, Win rate and Net rating. A sitting that touched more than one ladder shows a dash under Net rating, since there is no single rating for it to be the movement of. Every header sorts and every column carries a search box. Start prints as month-day and clock time inside the current year and grows a year on anything older, so typing part of a date into its box pulls up that stretch of evenings. Sorting on Net rating is how you find the sessions that cost you the most.
Opening a row shows the matches of that session and a tag control.
Session tags
Tags are free text with four suggestions on hand: warmup, tilted, lab,
flow. Click a chip to add it, click it again to remove it, and type anything
you like into the box beside them. Nothing enforces the suggested four.
A tag is stored against the first match of the session, because a match's key never changes while session ids do. Sessions are numbered by position in your history, so importing older matches or re-importing an overlapping export renumbers them, and a tag anchored to an id would drift onto somebody else's evening. Anchored to the opening match, "tag this session" keeps meaning what you meant.
Tags travel in your backups along with your notes. See the data page guide.
The settings that move this page
All of these are in Settings, and its guide covers the rest of what they touch.
| Setting | What it changes here |
|---|---|
| Session gap | Where one evening becomes two. Every per-session figure. |
| Tilt streak length | The run length After a streak conditions on, and the shuffled comparison beside it. |
| Kept playing window | Which next-matches count as queueing straight back in. |
| Took a break window | Which count as a break. |
| Minimum sample size | The floor under the cohort rows, under Sets and runbacks, under Switching character, under the occurrence count for character tilt, and under the matchup pointer. Double it and you have the sweet-spot floor. |
| Week starts on | The bin edges under Playtime / week. |
Two floors ignore your settings entirely: the readings inside Tilt want 20 in their cohort, and Rating given back wants ten sessions.