The priority board answers one question: which character is costing you rank. It is the middle of the three views linked by the strip under the heading, with Matchups cutting the same history by character and Opponents cutting it by person.
Everything on it comes from your imported matches. With none, the page says so and sends you to the Data page.
The line at the top
Above the tiles sits one sentence naming the leading row. It has three shapes, and which one you get is itself information.
Most of the time it names a character with a win rate, a game count and a rating figure. When that character sits under the sample floor it names them without a win rate, giving the record and the rating and saying how many games short of the floor it is. And when nothing on the board scores any pain at all, it says so plainly: no matchup is both under-performing your baseline and losing you rating. That third case is a finding. The board does not promote the least-bad row to fill the space.
What pain measures
Pain is counted in games. Take how far a matchup's win rate sits below your own overall win rate, multiply by how often you play it, and you have the wins that character owes you.
A rating check gates the whole thing. If a matchup has paid you rating overall, its pain is zero however badly you seem to be doing in it. Hard and profitable is not a leak, and the ladder is the arbiter of profitable.
The gate stays a gate and never becomes a multiplier. As a factor it would re-weight the score by how generous the ladder happened to be that week, and it double-counted the same underperformance, since rating bleed is largely the win rate again in different units. The old score multiplied a win-rate deficit by a rating balance, which produced a quantity with no nameable unit and grew with the square of how often you played somebody, so the board ranked exposure ahead of difficulty.
Ties break in a fixed order so the board does not reshuffle under you: pain, then confident rows ahead of badged ones, then games played, then the name.
The tiles
Biggest leak is the character from that leading row, with their record and win rate underneath. Rating lost there is what those games cost, over how many. Your baseline is your overall win rate and overall record, which is the figure every pain score is measured against. Painful matchups counts how many characters score above zero out of every character you have faced.
When nothing scores pain the first two tiles show dashes.
What's costing you rank
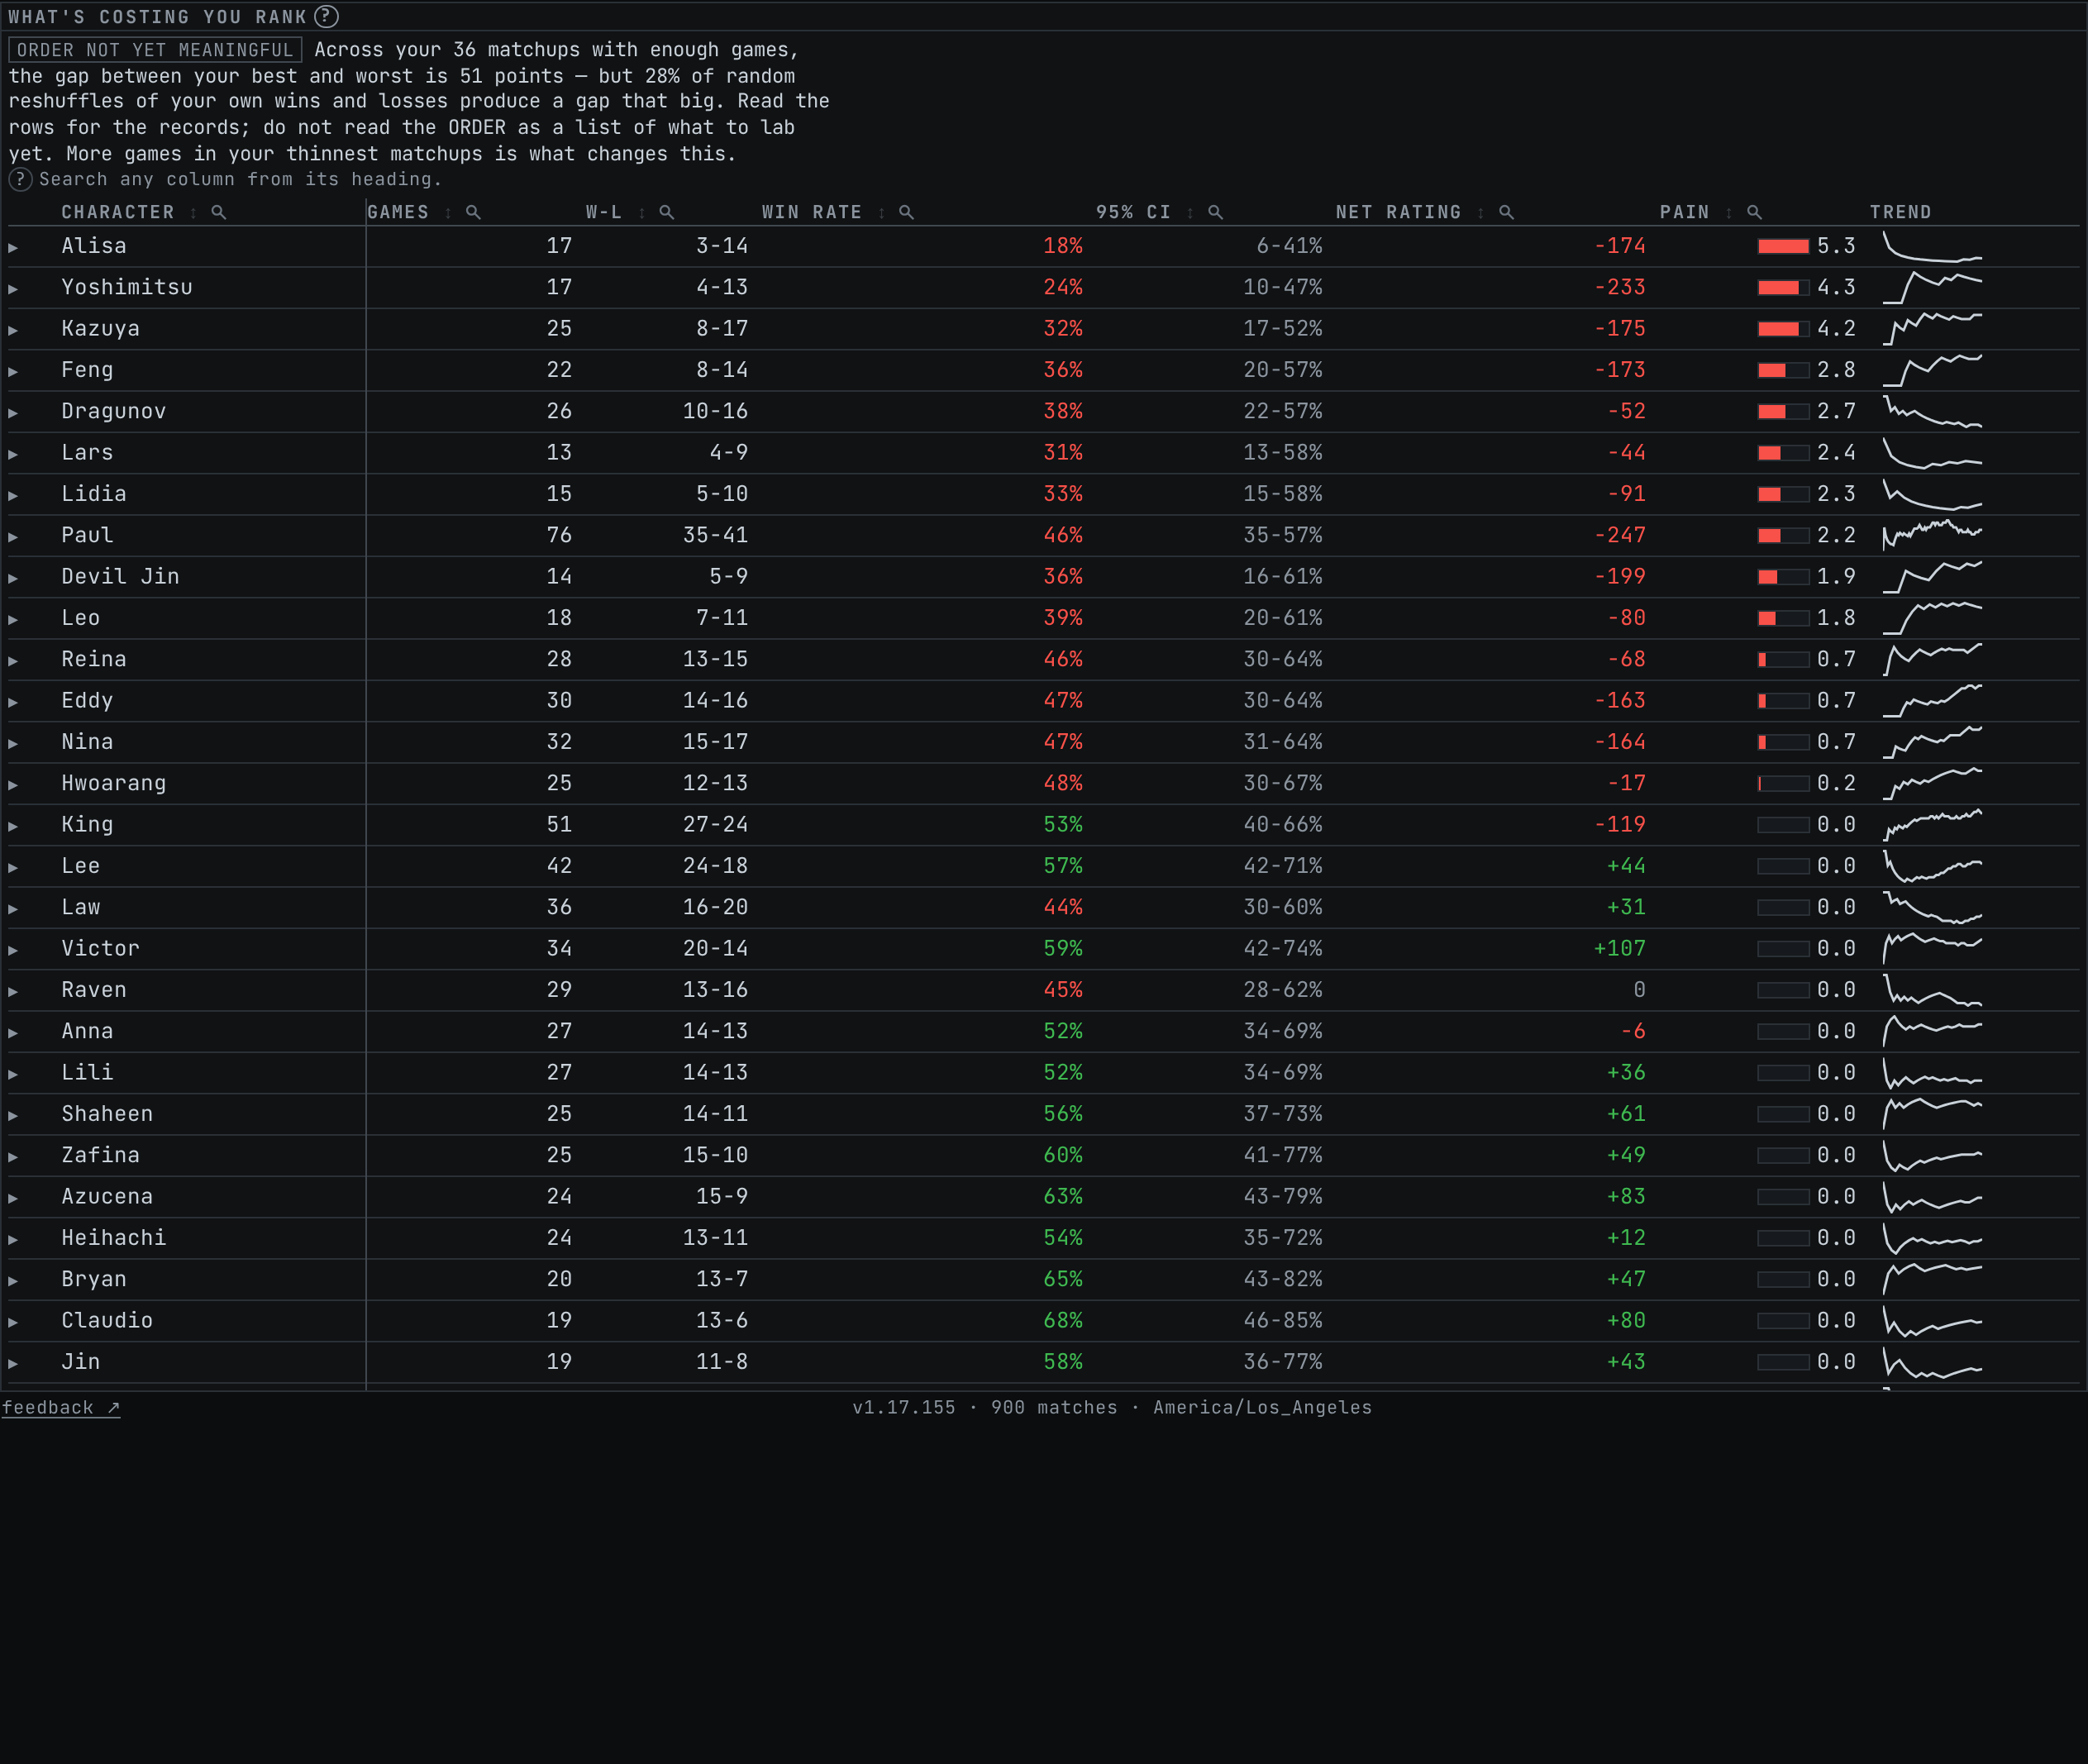
One row per opponent character, ranked by pain. The character column is pinned to the left edge, so the name stays put when the rest of the row scrolls sideways on a phone.
- Games is decided games, draws excluded.
- W-L is the record over those.
- Win rate is wins over decided games, or
not enough datawhen the row is under the floor. - 95% CI is the Wilson interval, or a dash under the floor.
- Net rating is what the matchup has paid or cost you. It is recovered from the ratings either side of each match, because the per-match change wavu displays is floored and does not add back up. The Matchups guide works that through.
- Pain is the score, printed as a number with a bar beside it. The bar is decoration and hidden from screen readers, so the ranking is never carried by length or colour alone.
- Trend is a rolling win rate against that character.
Every column heading can be sorted, and every one holds a search box behind the magnifier beside its label. Sorting by net rating or by games asks a different question of the same rows, and the order the page ships in is only one of them.
Why a thin row shows no percentage
A row with fewer decided games than the Minimum sample size setting is
badged low n, greyed, and has both its win rate and its interval withheld.
The cell says not enough data and the count is left visible so you can watch
it fill.
The reasoning is that a caveat next to a number does not stop anyone reading 0% over four games as a fact. Nothing is hidden: the row is still there, still ranked, still openable, and it still carries its record and its rating balance. What it will not do is print an estimate it cannot support.
Every page holds to this now, so a five-game matchup refuses to print a rate
here, on /matchups and on /opponents alike. The
Matchups guide sets out the rule and why withholding
beats printing the number with a warning attached.
The floor is yours to move, in Settings under Analytics. Raising it withholds more; lowering it withholds less. It changes nothing about what the underlying numbers are.
When the order is not evidence
Above the table you will sometimes find a badge reading order not yet meaningful, followed by a sentence with two figures in it.
Here is what it is doing. Sorting a couple of dozen matchups and reading off the top is a multiple-comparison problem, and the per-row intervals are not looking at it. Each row can be honestly hedged while the ranking between rows is still noise. So the page takes your own wins and losses, deals them back out at random across the same matchup sizes, and counts how often chance alone produces a best-to-worst gap as large as the one you actually have. If chance produces it often, the badge appears.
On a real five-hundred-match history that is exactly what happened: twenty-odd matchups above the floor, a forty-four point spread between best and worst, and seven reshuffles in ten producing a spread that big. Two characters that looked like a matchup problem were one coin landing differently.
Nothing is hidden or reordered when the badge shows. The ranking is still the best available guess. It is simply not yet evidence, and the badge sits above the table because a caveat printed under a sorted ranking arrives after the decision it was meant to inform.
The test needs at least three matchups above the floor to say anything, and it is seeded from your own data, so the answer never flickers between two loads. More games in your thinnest matchups is what changes it.
Opening a row
Every row expands, badged ones included. Behind it sits the answer to the question the ranking raises, for that character:
A practice line first, offering the quiz on that character's moves and any trainer drills built from their inputs. Then key moves: what that character beats you with, grouped by what the frames make them. Then what your own character does about it, which is a punish join against your most-played character and needs a second movelist, so it loads on its own. Then their strings, and what you get to do about them.
Every move on that shelf is a query over the character's own movelist, with the frames that put it in its group. The plus-on-block group excludes moves the defender can guard out of and any value published as a range that spans zero, because neither is reliably your turn. Reading the frame data covers those columns properly, and using frame data covers what to do with them.
Nothing on the shelf is scoped to your matches. It knows the character, not the player, and it knows nothing at all about movement, okizeme, or which of these moves the person who beat you actually presses. Frame data is a floor under the matchup. The rest is the glossary and the lab.
A character the frame corpus has never heard of gets a row on the board and nothing behind it, which happens because match names come from wavu and the movelists come from a corpus pull.
What this page will not tell you
It will not tell you that a matchup is hard. A low win rate against a character you play constantly and profit from scores zero here, and that is correct: the board is about rank, and the ladder is where rank comes from.
It will not tell you which people beat you. Two hundred games against one Dragunov and two hundred against a hundred different ones are the same row. Opponents is where that distinction lives.
It will not tell you that a character has got worse for you lately. The board is lifetime. Form over trailing windows is on Matchups, and how a matchup moved between the early games and the recent ones is on that character's own page.