The dashboard is what / opens on. Everything on it is derived from the matches
you imported, and the last panel is those matches with nothing done to them,
which is where to look first when a figure higher up seems wrong.
Two things sit above the panels and change what the rest of the page means, so they come first here too.
What stands out

The coach's note holds at most three sentences, and every one of them is a reading that has already cleared its own bar somewhere else on the site. Nothing is measured here. A matchup sentence needs the priority board to have picked a leading row, that row to have enough decided games behind it, and the board's ordering to have survived the reshuffle test that decides whether the ranking means anything at all. A tilt sentence comes through the same verdict function Sessions & tilt prints from.
Order is by what you could do about it. Top of the list is anything naming a character, since the site can hand you that character's key moves from there along with the drills that go with them. Under that sit readings that name a moment inside an evening: a run of losses, or the game straight after one. Last, and usually absent, is anything describing the shape of a whole evening, which is gated and true and still leaves you very little to act on. Where two findings share a tier, the one with more decided games behind it goes first.
Anything the dashboard already prints is excluded, so each line links to another page. That is most of the note's use — it points at the part of the site you had no particular reason to open.
The empty state is an answer
Nothing stands out — play on. You get that line in two situations: a history too short for any reading to have reached its floor, or a history where every reading has the games behind it and none of them points anywhere. Neither is a failure of the panel.
A reading that is withholding its estimate on its own page cannot appear here in softened form. If it did, you would follow the link and find the site declining to say the thing you had just been told.
The note is measured over your whole profile and is not affected by the character filter below it. That is why it sits above the filter and not under it.
Character, and sharing
The Character select scopes every panel below it. Its options are built from your full history, so a character never vanishes from its own dropdown while selected, and picking one narrows the tiles, the charts, the grid and the records to matches you played on that character.
The default is All characters, in which case the rating chart falls back to whichever character you have played most. Whether the choice survives a reload is up to Remember dashboard filter in settings. If a remembered character no longer appears anywhere in your data — you cleared and imported a different account, say — the page returns to All rather than showing you an all-zero dashboard.
Share a link is the same control that lives at the foot of the Data page, put here because this is where you are when you have something worth sending.
The tiles
Eight tiles at most, and two of them appear only when there is something to put in them.
- Record — wins, losses, win rate and total. Draws are counted in the total and excluded from the rate. They appear separately when you have any.
- 7 days — matches played in the last seven days, counted back from now.
- Rating Δ30d — see below.
- Avg session — mean length of a detected sitting, with how many sittings were detected. What counts as one sitting is the session gap in settings.
- Streaks — your longest win and loss runs, with whatever run you are currently on underneath. A draw breaks a run without starting one. Streaks are counted inside a single account, so a profile that unions two accounts never shows a run nobody actually played.
- Tilt — two of the six readings on Sessions & tilt. The headline is give-back: the rating a sitting hands back from its own high point, averaged over recent sessions, which is the number people mean when they say they should have stopped. Under it is how much sooner you queue again after a loss than after a win. Both wait until enough sittings are behind them and say so plainly until then.
- Rating vs record — see below.
- Stalest matchup — the character you play regularly and have gone longest without. Regularly is doing real work in that sentence: a row is eligible only once your lifetime games against that character reach the median across every character you have faced, and also clear your sample floor. Without that bar the tile would name whoever you met once during placements and never change. It says you have not played the matchup lately. It says nothing about the matchup having got worse.
Rating Δ30d, and why the per-match changes are never summed
This is the corrected rating movement over the last thirty days, on one ladder: the account and character you most recently played rated. The sub line names that character, because the page around the tile may be showing every character you own.
Wavu publishes a rating and a per-match change, and both are floored. Add the published changes up and you do not get back to the rating. Over one 447-match history the published changes sum to −72 while the rating itself went from 1678 to 1826, a real gain of 148. The shortfall is 220 points and the sign is inverted on top of that. Roughly half of all matches lose a point this way.
So the site recovers each match's true movement from the ratings on either side of it and totals that instead. Three situations defeat the reconstruction: the last match of a chain, with nothing after it to measure against; a missing rating; and an interval whose disagreement is too large to be explained by rounding. In each the published figure stands for that one match and nothing is invented around it.
Individual rows in the match log still show what wavu displayed. A row claiming +9 where wavu says +8 would read as a bug here instead of as rounding there.
If you take one thing from this page: do not add up the per-match changes yourself. The tile exists because that arithmetic is wrong.
Rating vs record
The gap between the rating your record alone predicts and the rating you actually hold, measured in games. Your record is wins minus losses. Your rating movement is converted into games by valuing each match at the stake its own ladder was paying around that time, which is the average swing of the hundred games surrounding it.
Games, and not points, because points do not transfer between ranks. The same 250 is a promotion at one rank and a rounding error at another, while "you are seven wins down" means the same thing to everybody. Nothing on this tile is a rating anyone holds; the panel below is where the actual ratings live.
A rating behind the record usually means your wins are landing against weaker opponents than your losses, or that the imported history has holes in it.
Your rating and your record disagree
This panel appears only when some ladder's two measures part company by more than a couple of games. A rating balance that matches the record is just the record, and does not need a panel.
A ladder here is one character on one account. That is what a rating belongs to in Tekken, and a profile on this site can union several accounts, so there is no such thing as your rating across a profile. Adding movements across ladders produces totals nobody ever held: on one history that arithmetic printed −421 across several ladders, and, filtered to Leroy, +529 from two accounts' Leroys added together against a real Leroy rating of 1703. Every row is measured on its own and nothing in the table is summed down a column.
Each row carries the character, your record on it, the ratings it ran between, what it moved, what a win pays there, what a loss costs, and how far that sits from the record. An account column appears in front when your profile unions more than one, since two rows can otherwise both say Leroy.
The Rating column is the checkable one. Those two numbers are what wavu showed you going in and coming out, and you can look them up. Everything else in the row is derived from them.
Win pays and loss costs are your last five hundred decided games on that ladder, both printed to one decimal. The whole claim rests on the gap between them, and rounding one to 11 while the other reads 11.2 would make it uncheckable. Lifetime averages would mislead here: the ladder's stake shrinks several-fold between placements and settled play, so a history whose losses happened to cluster in its first year would manufacture an asymmetry out of the calendar.
vs record is the same gap the tile shows, per ladder. It carries no green or red tint. Moved is tinted, because a rating going up is unambiguously good; this column answers a different question, and a row reading green +148 beside red −25 games invites you to ask which of the two is the real answer.
Under the table, one sentence about the widest ladder, stated as a percentage so it sizes itself. On a real history the asymmetry is often something like 11.0 against 11.2, and calling that "every game you win is worth less than every game you lose" would be describing a two percent difference in the language of a rigged ladder.
Below that, when both strength brackets clear your sample floor, the panel adds your win rate against opponents rated 100 or more below you and 100 or more above. The rates are facts. The clause that follows them, saying the missing points are in the harder games, is an inference, and it is only printed when the two 95% intervals actually separate.
A star next to a movement means the per-match changes on that ladder do not add up to the rating held, which happens when matches were played but never imported. Per-game figures are averages, so gaps do not distort them.
Rating — {character}
Your ladder rating after each match for the selected character, newest on the right. Six range buttons run along the header: session, today, 7d, 14d, 30d, all.
Session is the default and means everything since your last gap of the length set in settings. A multi-year line is dominated by wherever you started, so the whole history makes a poor default. One unlabelled hour with no way to widen it is no better, and that is what the other five buttons are for.
Today means since local midnight, not the last twenty-four hours. A sitting that ran past midnight is two days, and a rolling window would merge them.
The line begins at the rating you took into the first match shown, not at the rating you left it with. Without that, the leftmost point is already one game into the range, and a range is read from its leftmost point. On one fixture sitting that error drew a four-point loss as an eleven-point gain.
The chip beside the buttons is σ² and the rating group from your export snapshot, when that character appears in it. Switch to the table view and you also get a Peak row, which is the character's all-time peak whatever range is selected, and a Start row carrying the rating you went in on. Long ranges list the most recent thirty points and say how many earlier ones are not shown.
Underneath the chart is a strip of your last few sittings on that character, at the same gap. Each figure there is the rating you finished on minus the rating you went in with, taken from the two endpoints. It is never the per-match changes added together, for the reason given above.
Matches / day
One point per calendar day you played, in your time zone. Days you did not play are skipped, so a fortnight away closes up into a gap on the axis instead of a fortnight of zeroes. The table view lists the most recent thirty days.
Fatigue — win rate by match № in session
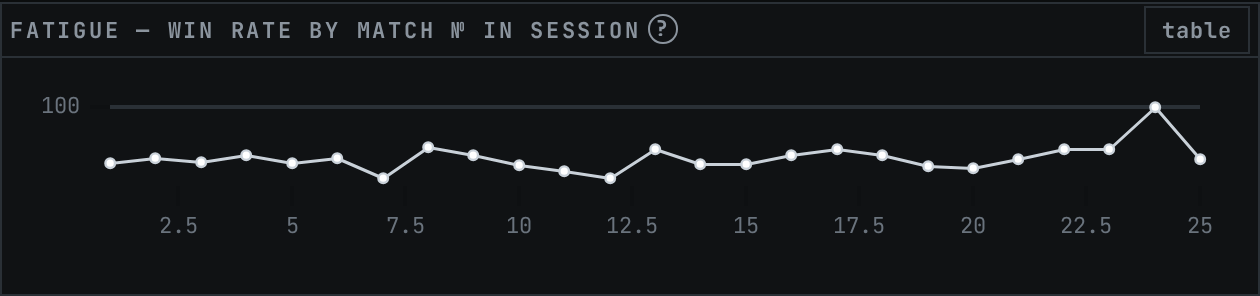
Win rate by position inside a sitting: every first match pooled, every second match pooled, and so on out to twenty-five. Fatigue, if you have it, shows up as a downward slope.
Trust the right-hand side of this line less than the left. Few sittings run long enough to feed the far positions, and the table view carries the n for each so you can see where the evidence thins out.
Warm-up effect
Two rows, no verdict: the first game of every session against everything after it, with the decided count beside each. Draws count toward neither.
There is one blind spot worth knowing about. This cannot separate a genuine warm-up curve from who happens to be queueing at the hour you usually start.
Clutch & dominance
The one panel on the page counting rounds instead of matches.
Round win rate includes rounds you took in matches you went on to lose. Went the distance is the share of scored matches that finished one round apart, which means the loser reached match point — whatever the format, so a 2-1 counts the same as a 3-2. Deciding round is your record in exactly those matches. Both come off one count, so the share and the record under it can never disagree. Shutouts are matches where the loser never scored, in both directions.
The sentence at the foot compares your rate in the close matches against your rate across every match carrying a score. Those close matches are part of that overall figure and not held out beside it, so read the gap as a direction more than a size. Below your sample floor the panel says it has not seen enough deciding rounds yet and prints no comparison.
On comebacks: wavu records the score and not the order the rounds fell in. "Did you win after dropping round one" is not thin here, it is unavailable, and no sample size fixes that. Inferring it from a total would be inventing the match.
Strength of schedule
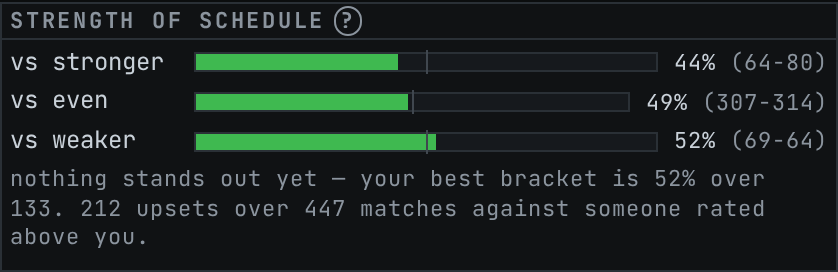
Three bars, split on the rating gap going into each match. Opponents rated more than 100 above you are stronger, more than 100 below are weaker, and everything between counts as even — both boundaries inclusive, so exactly ±100 lands in the middle band. Matches missing either rating are skipped rather than treated as a gap of zero.
Under the bars sits a title, or more often no title. Giant killer, Gatekeeper and Even-match specialist are awarded only when a bucket's Wilson lower bound clears its line over at least twenty games, so a small sample cannot earn one. With nothing earned the panel states which bucket you did best in and leaves it there.
Calibrate against this: roughly 42% against higher-rated opponents is about what the rating system expects of you, which is why decent numbers go untitled. A label everyone gets is worth less than no label, because it makes the earned ones mean nothing.
The line ends with your upset count over matches against someone rated above you.
Win rate by my character
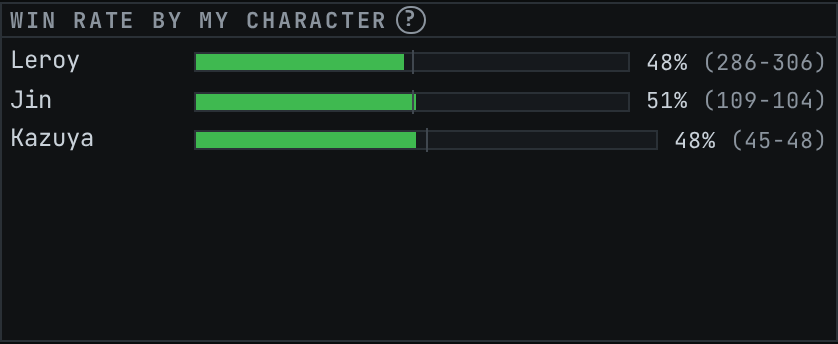
Your ten most-played characters as bars, each with its record beside it. A
character under your sample floor dims and reads not enough data where the
percentage would be, so a handful of games never prints a rate here. The record
still shows, which is how you see how close it is to counting.
Each character here is its own ladder carrying its own rating. The rating panel above therefore shows one at a time.
Matchups — vs opponent characters
One cell per opponent character, ordered by how often you have met them. Colour is win rate: the further from 50%, the stronger the tint, up to a cap.
Colour intensity is distance from 50% and nothing else. The decided count only decides whether a cell is painted at all, so a 2-0 against someone you have barely met burns as brightly as a 40-10. Each cell prints its rate and its n, and the n is the number to weigh the colour against.
Hovering or focusing a cell adds how long since you last played that matchup and how many games of it you have played in the last ninety days. The table view carries both as sortable columns, which is where to go if you want to read freshness across every matchup at once instead of one at a time.
Colour cannot tell you what to do about a bad matchup, and a bad matchup you meet constantly costs you more than a terrible one you almost never see. The priority board is the panel that weighs those two together, and the link in this panel's header goes there.
Records
Things that happened. Everything else on this page carries a floor, an interval or a baseline; nothing here does, because a peak rating is not a claim about anybody's ability. It is a number somebody once held. That is also why no figure on this panel is tinted up or down.
Peak rating is per ladder, with the rating now, the rated games behind it, and how long ago the peak was reached. Six ladders at most, since a profile unioning several accounts can carry a dozen and this is a board to read. The longest win streak is counted inside one account for the reason the Streaks tile gives. Round totals pool across accounts, which is safe for a running count in a way a streak is not, and the panel names the next landmark and how far off it is. Rivalries cover anyone you have played five or more times.
Times are relative, and stay relative. The match log is where exact timestamps live.
Activity — hour × day ({time zone})
A 7 by 24 grid of when you play, in the zone named in the title, with the week starting on the day set in settings. The header toggles what the colour means: volume shades cells by matches played on a grey ramp, and win rate switches to the diverging scale.
In win-rate mode a cell below your sample floor renders neutral however extreme its raw rate. One lucky win at 3am must not paint 3am as your best hour.
The four cards beside the map name your best and worst hour and your best and worst day. Above them, when it applies, is the badge that matters more than the cards do.
Read the badge before the cards
Cutting a record into two dozen buckets, sorting them, and reading off the ends is a multiple-comparison problem, and per-bucket intervals do not catch it. Each bucket can be honestly hedged while the ranking between them is still noise.
So the gap between your best and worst bucket is tested directly: the same wins and losses are reshuffled across the same bucket sizes a couple of thousand times, and the panel counts how often chance alone produces a gap that big. When it does so often, the cards keep their numbers and lose their colour, and a not a schedule yet badge appears with the actual figures. On one real history the best-to-worst spread was 25 points and 42% of reshuffles matched or beat it.
The caveat is printed above the cards on purpose. A caveat under a conclusion is read after the decision it was meant to inform.
The reshuffle is deterministic, so the verdict does not change between two loads of the same data. Below three qualifying buckets there is no test at all, and the cards stay untinted and unbadged, because a ranking that was never tested has not earned a colour either.
The table alternative is behind the table button in the panel header, like every other chart on this page. It is not under the grid. Per-cell counts are hidden on narrow screens; the table view has them at any width.
Recent matches
Your last twenty matches, newest first, exactly as imported. Everything else on this page is derived from these rows, so this is the place to check a figure that looks wrong. The all link opens the full match log, where you can filter and search.